 ChatGPT
 Perplexity
.png)
.png)
.png)
Build your first embedded data product now. Talk to our product experts for a guided demo or get your hands dirty with a free 10-day trial.


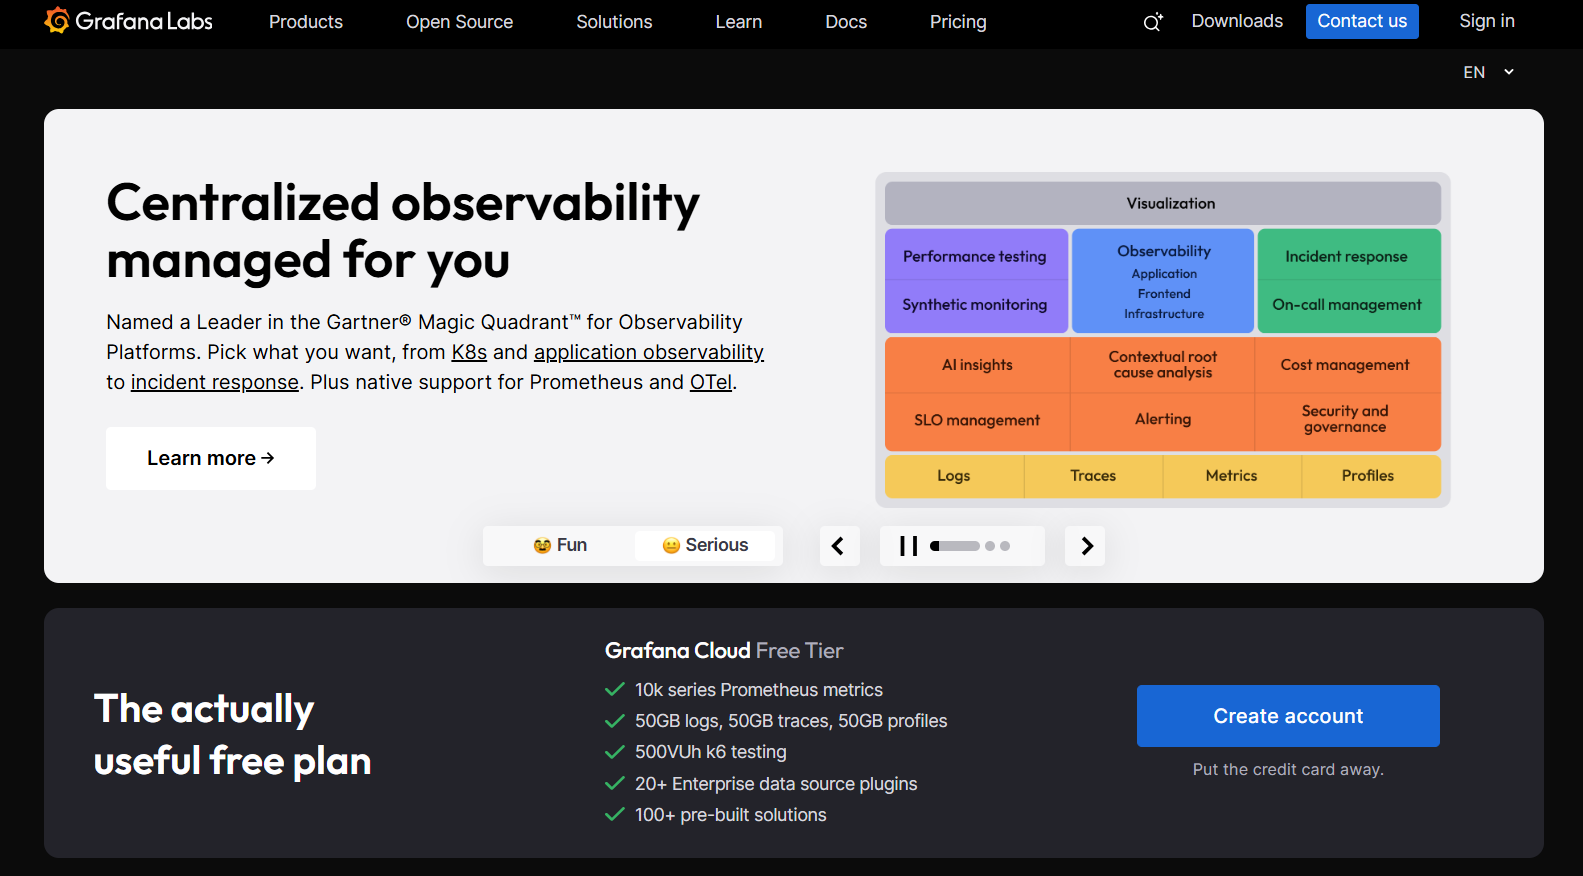
Grafana is a popular open-source tool for real-time data visualization and analysis from various data sources. Users can create fully customizable dashboards that display key metrics, graphs, charts, and alerts through its interactive interface.
While this observability platform is powerful, it can be complex to start with, and it has numerous limitations that depend on your use case.
So, if you’re looking for Grafana alternatives, you’ve come to the right place.
Grafana is an open-source platform for data visualization that connects to many databases. It started out as a visualization tool that allows businesses to create, explore, and share interactive dashboards internally or with other stakeholders.
Some of the key uses for Grafana include:
Grafana has every functionality you may need for end-to-end data collection and visualization. However, there are some reasons why people look into alternatives.
Grafana has every functionality you may need for end-to-end data collection and visualization. However, there are some reasons why people look into alternatives.
Steep learning curve: Grafana can be difficult for beginners unfamiliar with time-series databases who do not know every query language possible.
“It is a steep learning curve, not just the product but all of the different connections that it supports.”
Limited built-in data storage: Grafana mostly relies on external data sources such as Prometheus and InfluxDB to fetch your data. This increases pricing but makes it more difficult to set up Grafana properly.
Scalability challenges: as you add more data sources and users, Grafana’s performance downgrades, which can be a big downside if you want the end-user to get fast, custom dashboards.
Alerting limitations: Grafana works well for setting up basic alerts e.g. in SaaS tools. However, if you need more granular alerts for specific actions, you must rely on third-party tools and plugins.
Role-based access control limitations: The free version of Grafana has fairly limited role-based access. This can be a huge obstacle in large organizations and when dealing with many end-users.
Limited customization: Grafana offers a decent number of visualization types and possibilities for customizing dashboards. However, some users may need more variety in visualizations and detailed customization options that they can only get with third-party plugins and manual coding and design.
Mohnish T.:
“…maybe a proper low light dropdown with clear UI if possible will be clear to understand.”
Modern embedded analytics platforms like Luzmo Studio address this by providing a flexible visual dashboard builder that integrates directly into your application, while AI-powered tools such as Luzmo IQ and Luzmo AI allow users to explore their data, generate charts, and uncover insights using natural language—without relying on plugins or complex configuration.
How good is your dashboard UX?
DOWNLOAD NOW!
✔️ FREE CHECKLIST: put your client-facing analytics to the test!

Whether you want to create customized dashboards or set up alerts for yourself or your end users, Grafana is just one of the many choices. Here are some alternatives that fit any budget.
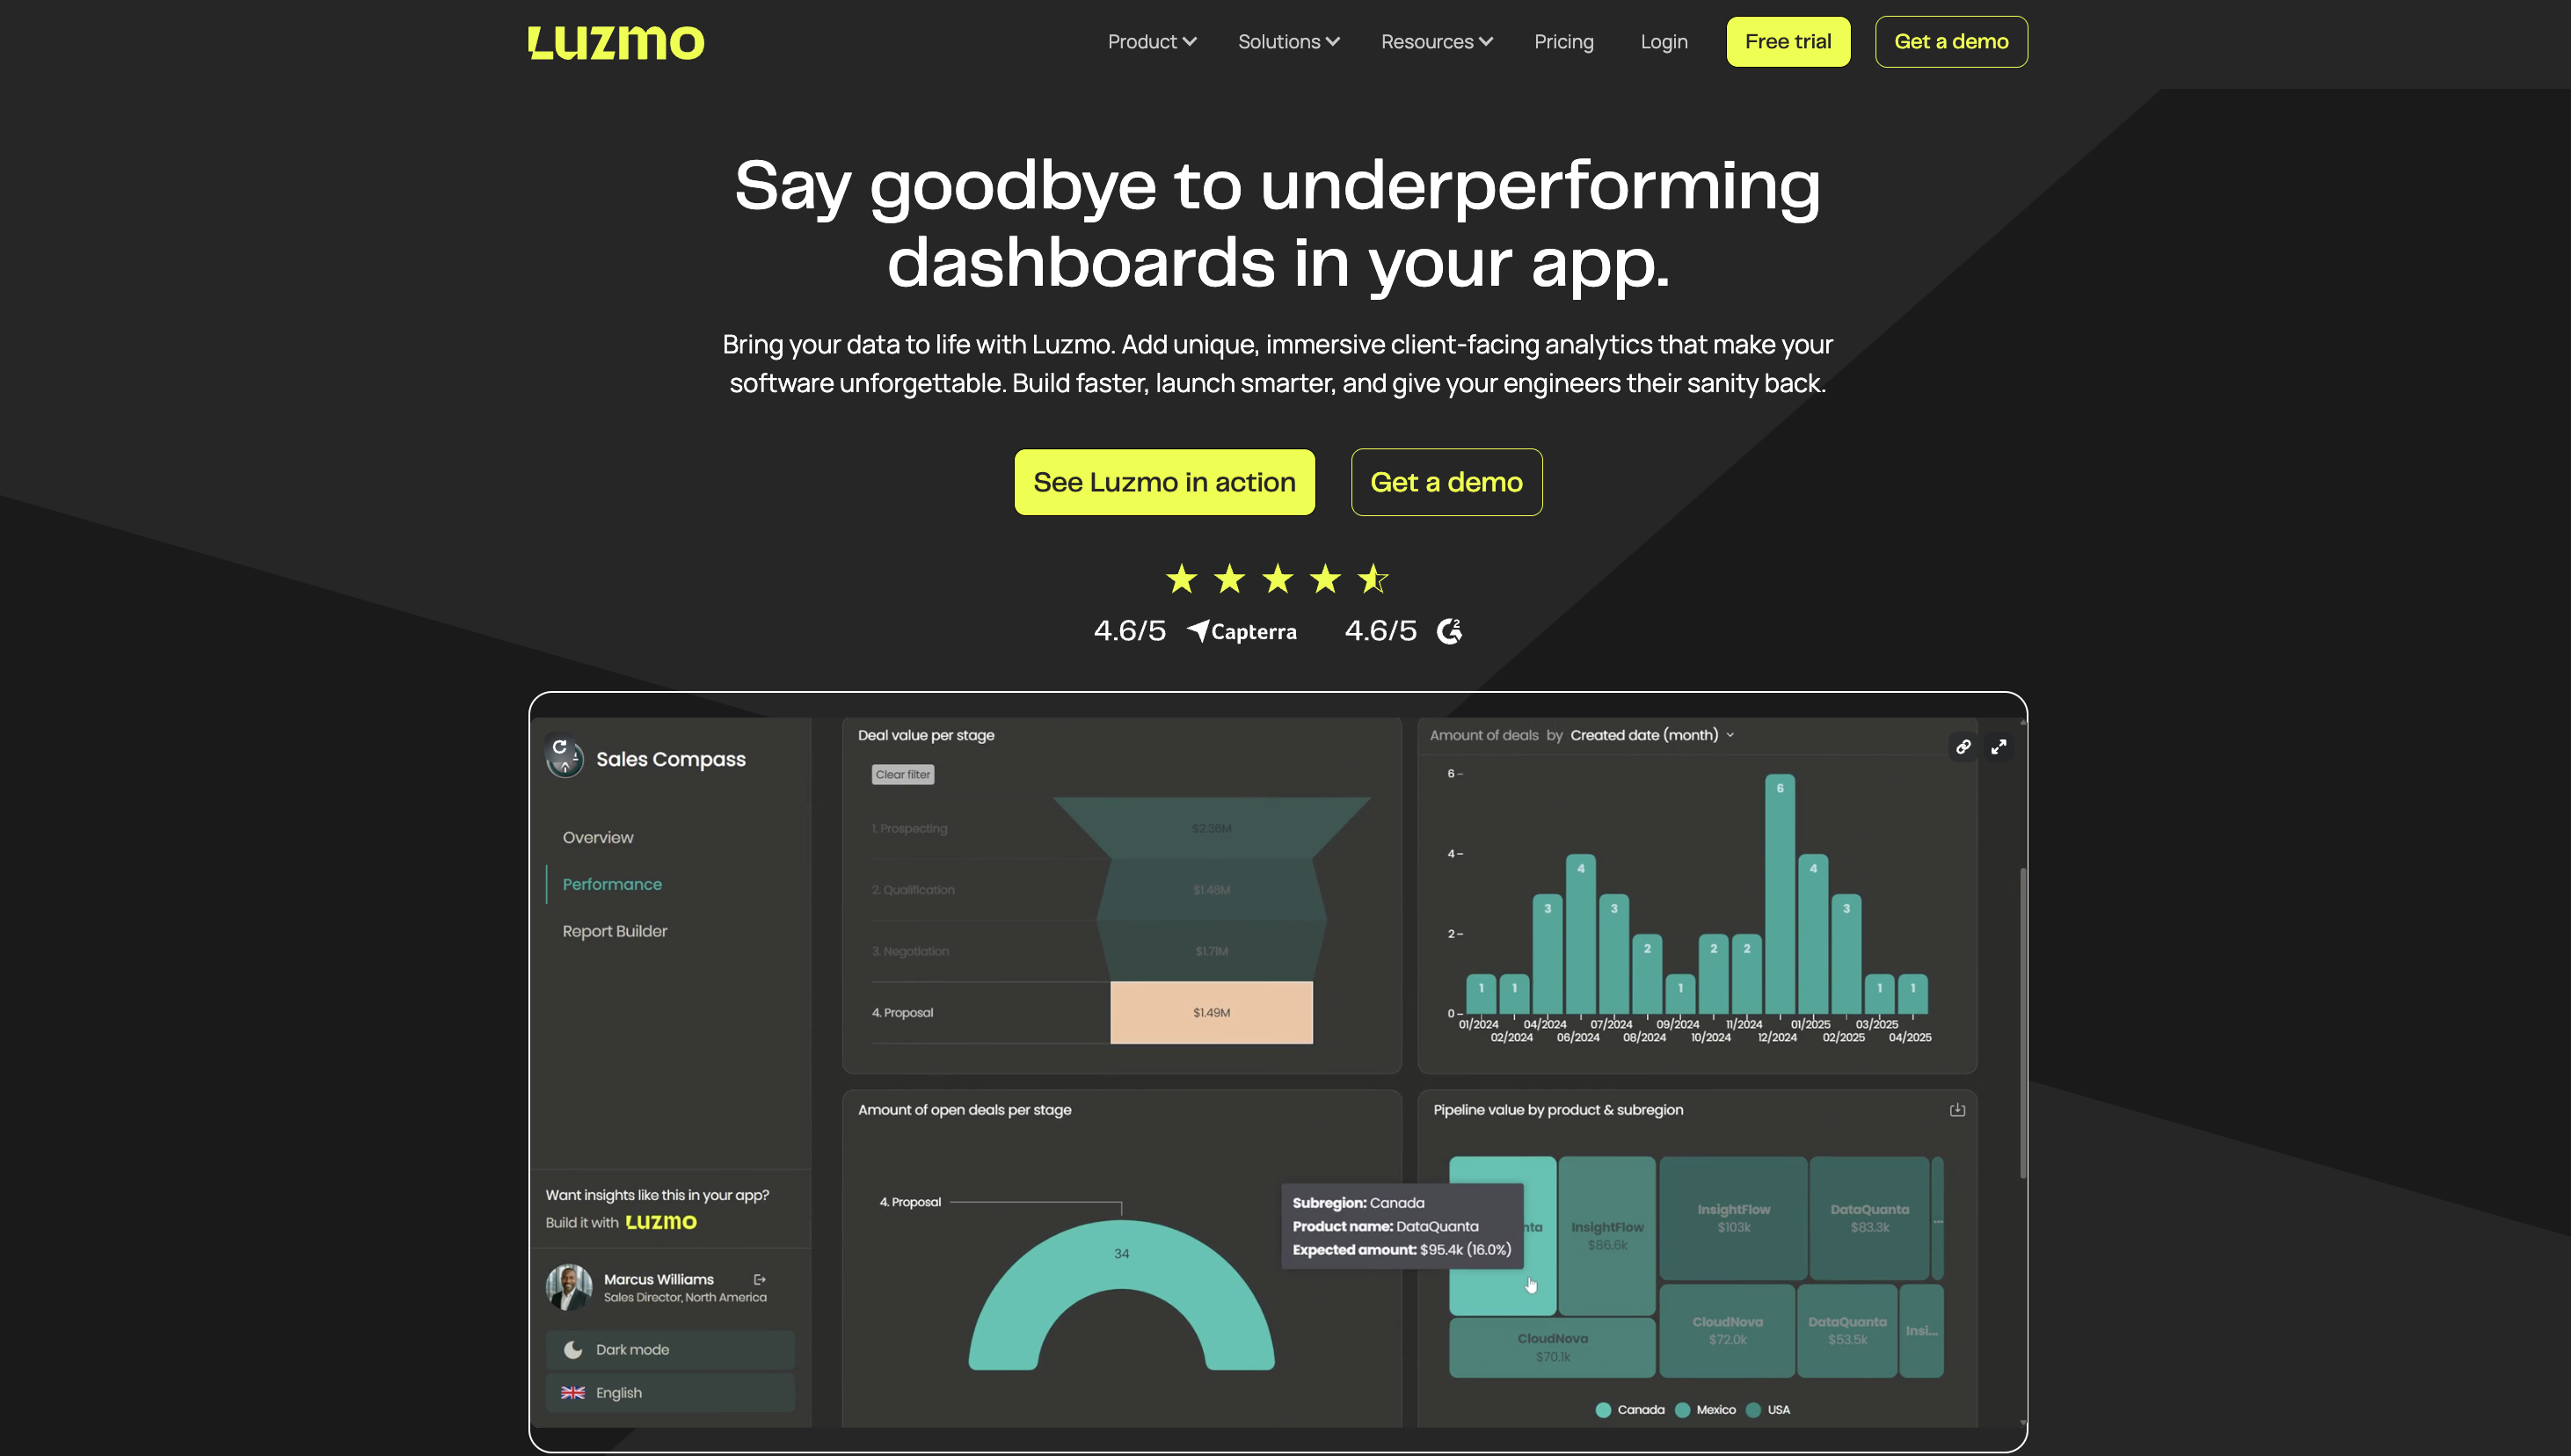
Luzmo is an excellent Grafana alternative for software companies that want to go beyond monitoring and visualization and deliver a modern analytics experience directly inside their app. While Grafana provides great dashboards for system health and synthetic monitoring, Luzmo focuses on embedded analytics that help your users make smarter, data-driven decisions.
With Luzmo Studio, teams can build interactive dashboards using an intuitive visual builder, while Luzmo Flex gives developers complete freedom to customize layout, connect data from multiple sources, and control the full look and feel. For non-technical users, Luzmo IQ introduces AI-powered analytics that allows you to query data in natural language - simply ask a question, and IQ creates a chart instantly.
Behind the scenes, Luzmo Agent APIs automate analytics workflows and data delivery, even when you’re working with large volumes of data. The result is a smoother, faster, and more scalable overall experience for your end-users.
You can also share dashboards easily with your customers or internal teams, letting them explore and interact with data in real time. Unlike Grafana, Luzmo’s wide choice of visualization types - from bar charts to Gantt charts and heatmaps - makes it perfect for both technical and business use cases.
Luzmo is fully customizable, integrates seamlessly with your product, and scales effortlessly as your data grows. The best part? You can try it out for free or book a demo to see how Luzmo Flex, Studio, IQ, and Agent APIs can help you build better embedded dashboards than any other alternatives to Grafana.
Pricing: Plans start at €495/month (Starter) and €1,995/month (Premium), billed annually. Enterprise plans with custom pricing are available. Pricing scales with Monthly Active Users (MAUs). See Luzmo pricing →

Kibana is the top Grafana alternative for developers fluent in Javascript who want to visualize their Elasticsearch data. It lets you manage the Elastic stack (Elasticsearch, Beats, Logstash) and visualize data in customizable dashboards.
If you already use Elastic stack for your search and analytics, this is the first choice for data visualization. However, note that you don’t have many dashboards to choose from. Also, you must work with other tools in the ELK stack, limiting customization space.
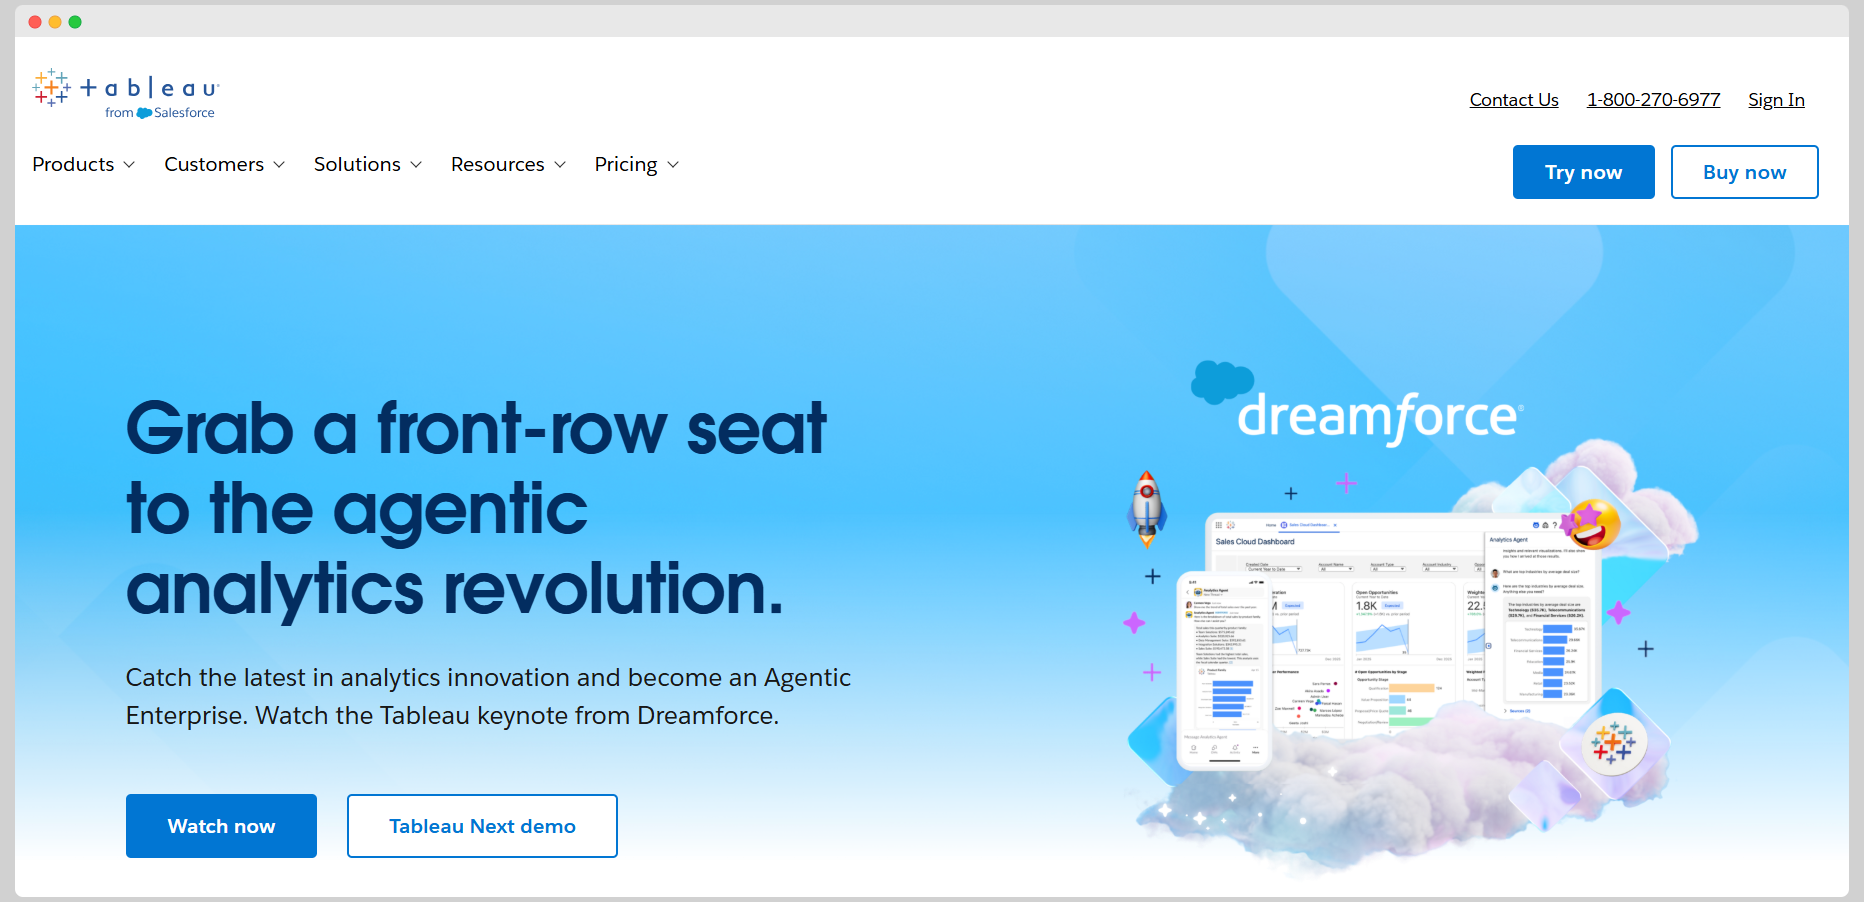
If you want to visualize data for internal stakeholders and even end-users of your software, Tableau is one of the leading platforms in the BI industry. Launched by Salesforce, it is well-known for its huge variety of visualization types and integrations with the Salesforce ecosystem.
Conversely, Tableau can be very complex for beginners, especially if you want to use it in an embedded setting. You can solve this by hiring a Tableau expert, and there are plenty to go around. One thing you cannot solve so easily is the pricing, which can quickly go out of hand with many creators, users, and dashboard viewers.
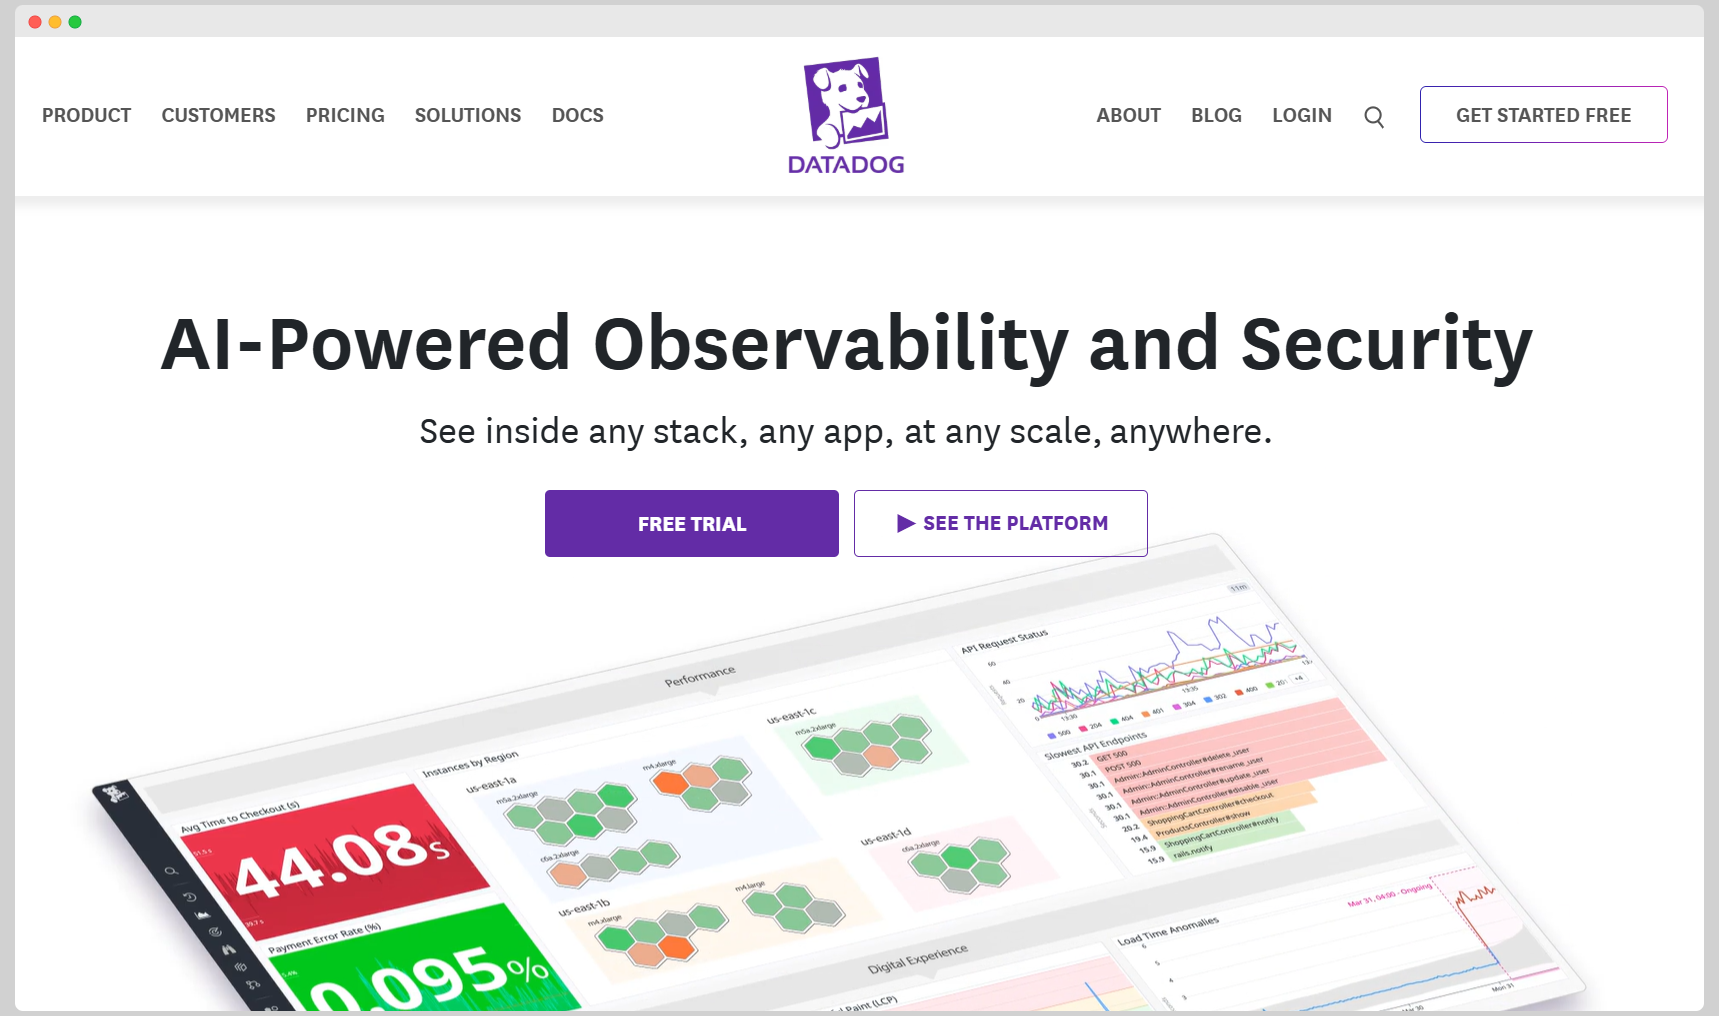
Datadog is one of the most popular cloud-based Grafana data visualization and monitoring alternatives. It covers multiple use cases such as infrastructure, logs, user experience and applications.
It offers 800+ integrations with various data sources and many dashboards you can try out of the box. Datadog retains your metrics for up to 15 months. In the more expensive plans, you get machine-learning-based alerts and live processes.
The downside of Datadog is that it can get pretty expensive since pricing is based on data usage. Also, the visualizations are limited compared to Grafana’s dashboards.
Prometheus is an open-source, high-performance system for collecting metrics and alerting. It works in real time and records metrics in a time series database and it is great for scaling. Given its strong time-series data support, it works well for Kubernetes monitoring.
One issue is that Prometheus is not a proper data visualization tool on its own, so you’ll likely pair it with a tool such as Grafana anyway. It also does not have native support for complex querying.
This is a purpose-built time-series database with a high write performance. It supports complex time-series queries and alerting, and it’s great for monitoring IoT and DevOps metrics. You can query data in InfluxDB by using SQL for real-time insights. It can be purchased in a fully managed or self-hosted version. InfluxDB supports over 300 integrations with various data sources and business apps.
The negative side of this platform is that compared to Grafana, it’s pretty limited in the types of visualizations it offers. Regarding data sources, there is not much flexibility beyond those not bound to time-series data and InfluxDB.

New Relic is a full-stack observability platform that offers advanced application performance monitoring (APM) features and deep performance insights for organizations with complex applications.
Compared to Grafana, New Relic can be very expensive. Another downside is that it’s primarily app-focused and does not have the varied customization options of Grafana and similar tools.
Splunk is a comprehensive platform for log analysis and real-time management of events with enterprise-grade features. It’s a superb choice for IT operations and security because of its many compliance capabilities. It works great for anomaly detection thanks to its machine learning and AI insights.
Compared to Grafana and other alternatives on this list, Splunk can be pretty pricey. It’s also log-centric so it lacks Grafana’s multi-source dashboard capabilities.
Grafana was built for infrastructure and application monitoring — primarily for DevOps and engineering teams who need to visualize time-series data from systems like Prometheus, InfluxDB, and Elasticsearch. It is excellent at that use case. For software teams building customer-facing analytics into a product, it is generally not the right tool, and the alternatives worth evaluating are different from those that compete with Grafana for internal observability use cases.
The core mismatch is audience. Grafana dashboards are designed for engineers who understand the data source and the metrics being displayed. They can navigate complex panel configurations, understand what a query is doing, and tolerate a technical interface. End users of a software product — customers who want to see their own data presented clearly inside the application they pay for — have very different expectations. They expect a polished, branded experience with no visible query logic, no infrastructure terminology, and interactive controls that work without configuration.
Multi-tenancy is the second gap. In a customer-facing analytics context, each customer should see only their own data. Grafana's access control model was not designed for this at scale. Implementing row-level security that isolates each customer's data reliably, across a large user base, requires significant custom engineering that Grafana does not provide out of the box.
For software teams that need embedded analytics specifically — not internal observability — the more relevant alternatives are purpose-built embedded analytics platforms. Luzmo AI is designed for this use case: it connects to your data source, handles multi-tenant data isolation natively, and exposes an AI-powered analytics experience inside your product that end users can interact with in plain language, without any Grafana-style query interface.
Grafana competes in a crowded space, and the right alternative depends heavily on whether the primary use case is internal monitoring, internal BI, or customer-facing embedded analytics. The following covers the most common comparison scenarios.
Datadog and New Relic are the two main commercial alternatives to Grafana for observability. Both offer richer out-of-the-box integrations, managed infrastructure, and more polished alert management than a self-hosted Grafana instance. The trade-off is cost: both are significantly more expensive than Grafana, which is free to self-host. Teams that need reliable observability without the overhead of maintaining their own Grafana deployment typically find one of the two a worthwhile investment.
Metabase is a strong alternative for teams that need business analytics — sales, marketing, operations — rather than infrastructure monitoring. It is significantly easier to set up than Grafana for business data use cases, has a cleaner interface for non-technical users, and does not require knowledge of PromQL or similar query languages. Redash and Apache Superset cover similar ground with more SQL flexibility.
Grafana is rarely evaluated for embedded analytics, but teams sometimes reach for it when they have an existing Grafana setup and want to reuse it for customer dashboards. This works for technical user bases but fails for general end users. Purpose-built embedded analytics platforms — including Luzmo AI — provide the white-label styling, multi-tenant data isolation, and natural language interaction that Grafana cannot offer without substantial custom development.
If the primary use case is time-series monitoring of infrastructure or application metrics, and the audience is an engineering or DevOps team, Grafana remains one of the best options available. Its deep integration with Prometheus, Loki, and Tempo, combined with its extensive plugin ecosystem and the fact that it is free to self-host, makes it hard to displace for this specific use case.
Grafana is one of the most widely used data visualization tools in the world, but its strengths are specific enough that using it outside its core use case creates friction that is worth accounting for before committing.
Grafana works well when the data source is a time-series database or metrics store, the audience has technical familiarity with the data being displayed, the dashboards are for internal use rather than customer-facing deployment, and the team has the engineering capacity to manage a self-hosted instance or is willing to pay for Grafana Cloud. For infrastructure monitoring, log aggregation, and application performance dashboards within a technical organization, it is genuinely strong.
Grafana creates friction when the data source is a relational database or data warehouse rather than a time-series store — Grafana's query model is not optimized for this, and building dashboards against SQL databases requires more configuration effort than comparable BI tools. It also creates friction when the audience includes non-technical users, when dashboards need to be embedded in a third-party application with strict styling requirements, or when multi-tenant data isolation is a hard requirement.
The decision framework is: if you are monitoring systems and your audience is engineers, Grafana is a strong choice. If you are visualizing business data for analysts, a dedicated BI tool will be more productive. If you are embedding analytics in a product for customers, a purpose-built embedded analytics platform will be more appropriate — and will avoid the substantial engineering work required to make Grafana work in that context.
Grafana boldly promises to help with data visualization and alerting, but it’s not built for everyone. Complex onboarding, scalability issues, and problems with customization are all valid reasons to look elsewhere for an alternative solution.
With Luzmo, you can visualize your data in your app and give your end-users the power to understand data points in real-time, on their own terms. With powerful AI features and a variety of data sources, Luzmo can fit into any app.
Book a free demo with our team, and we’ll show you how it works.

All your questions answered.
What should I look for in a Grafana alternative?
Is Grafana suitable for embedded analytics in SaaS products?
How does AI improve modern dashboard tools?
Build your first embedded data product now. Talk to our product experts for a guided demo or get your hands dirty with a free 10-day trial.


