Product roadmap
Your users don't only ask questions inside your product anymore. They ask in ChatGPT, in Claude, in the assistants your team is building. Here's what we're working on in Q4 2026 to meet them there.

Our focus
Three things we're building toward
Agent-ready data
Add business knowledge, semantic context, and formulas. Accelerate queries and create tenant datasets.
Luzmo Agent
A dedicated agent for embedded data analysis. Generate visualizations and reports that work in any app, MCP, or AI tool.
Governance
Monitor the agents your customers use, review the answers and reports they generate, and adjust agent behavior where needed.


What we're working on this quarter
Verified answers
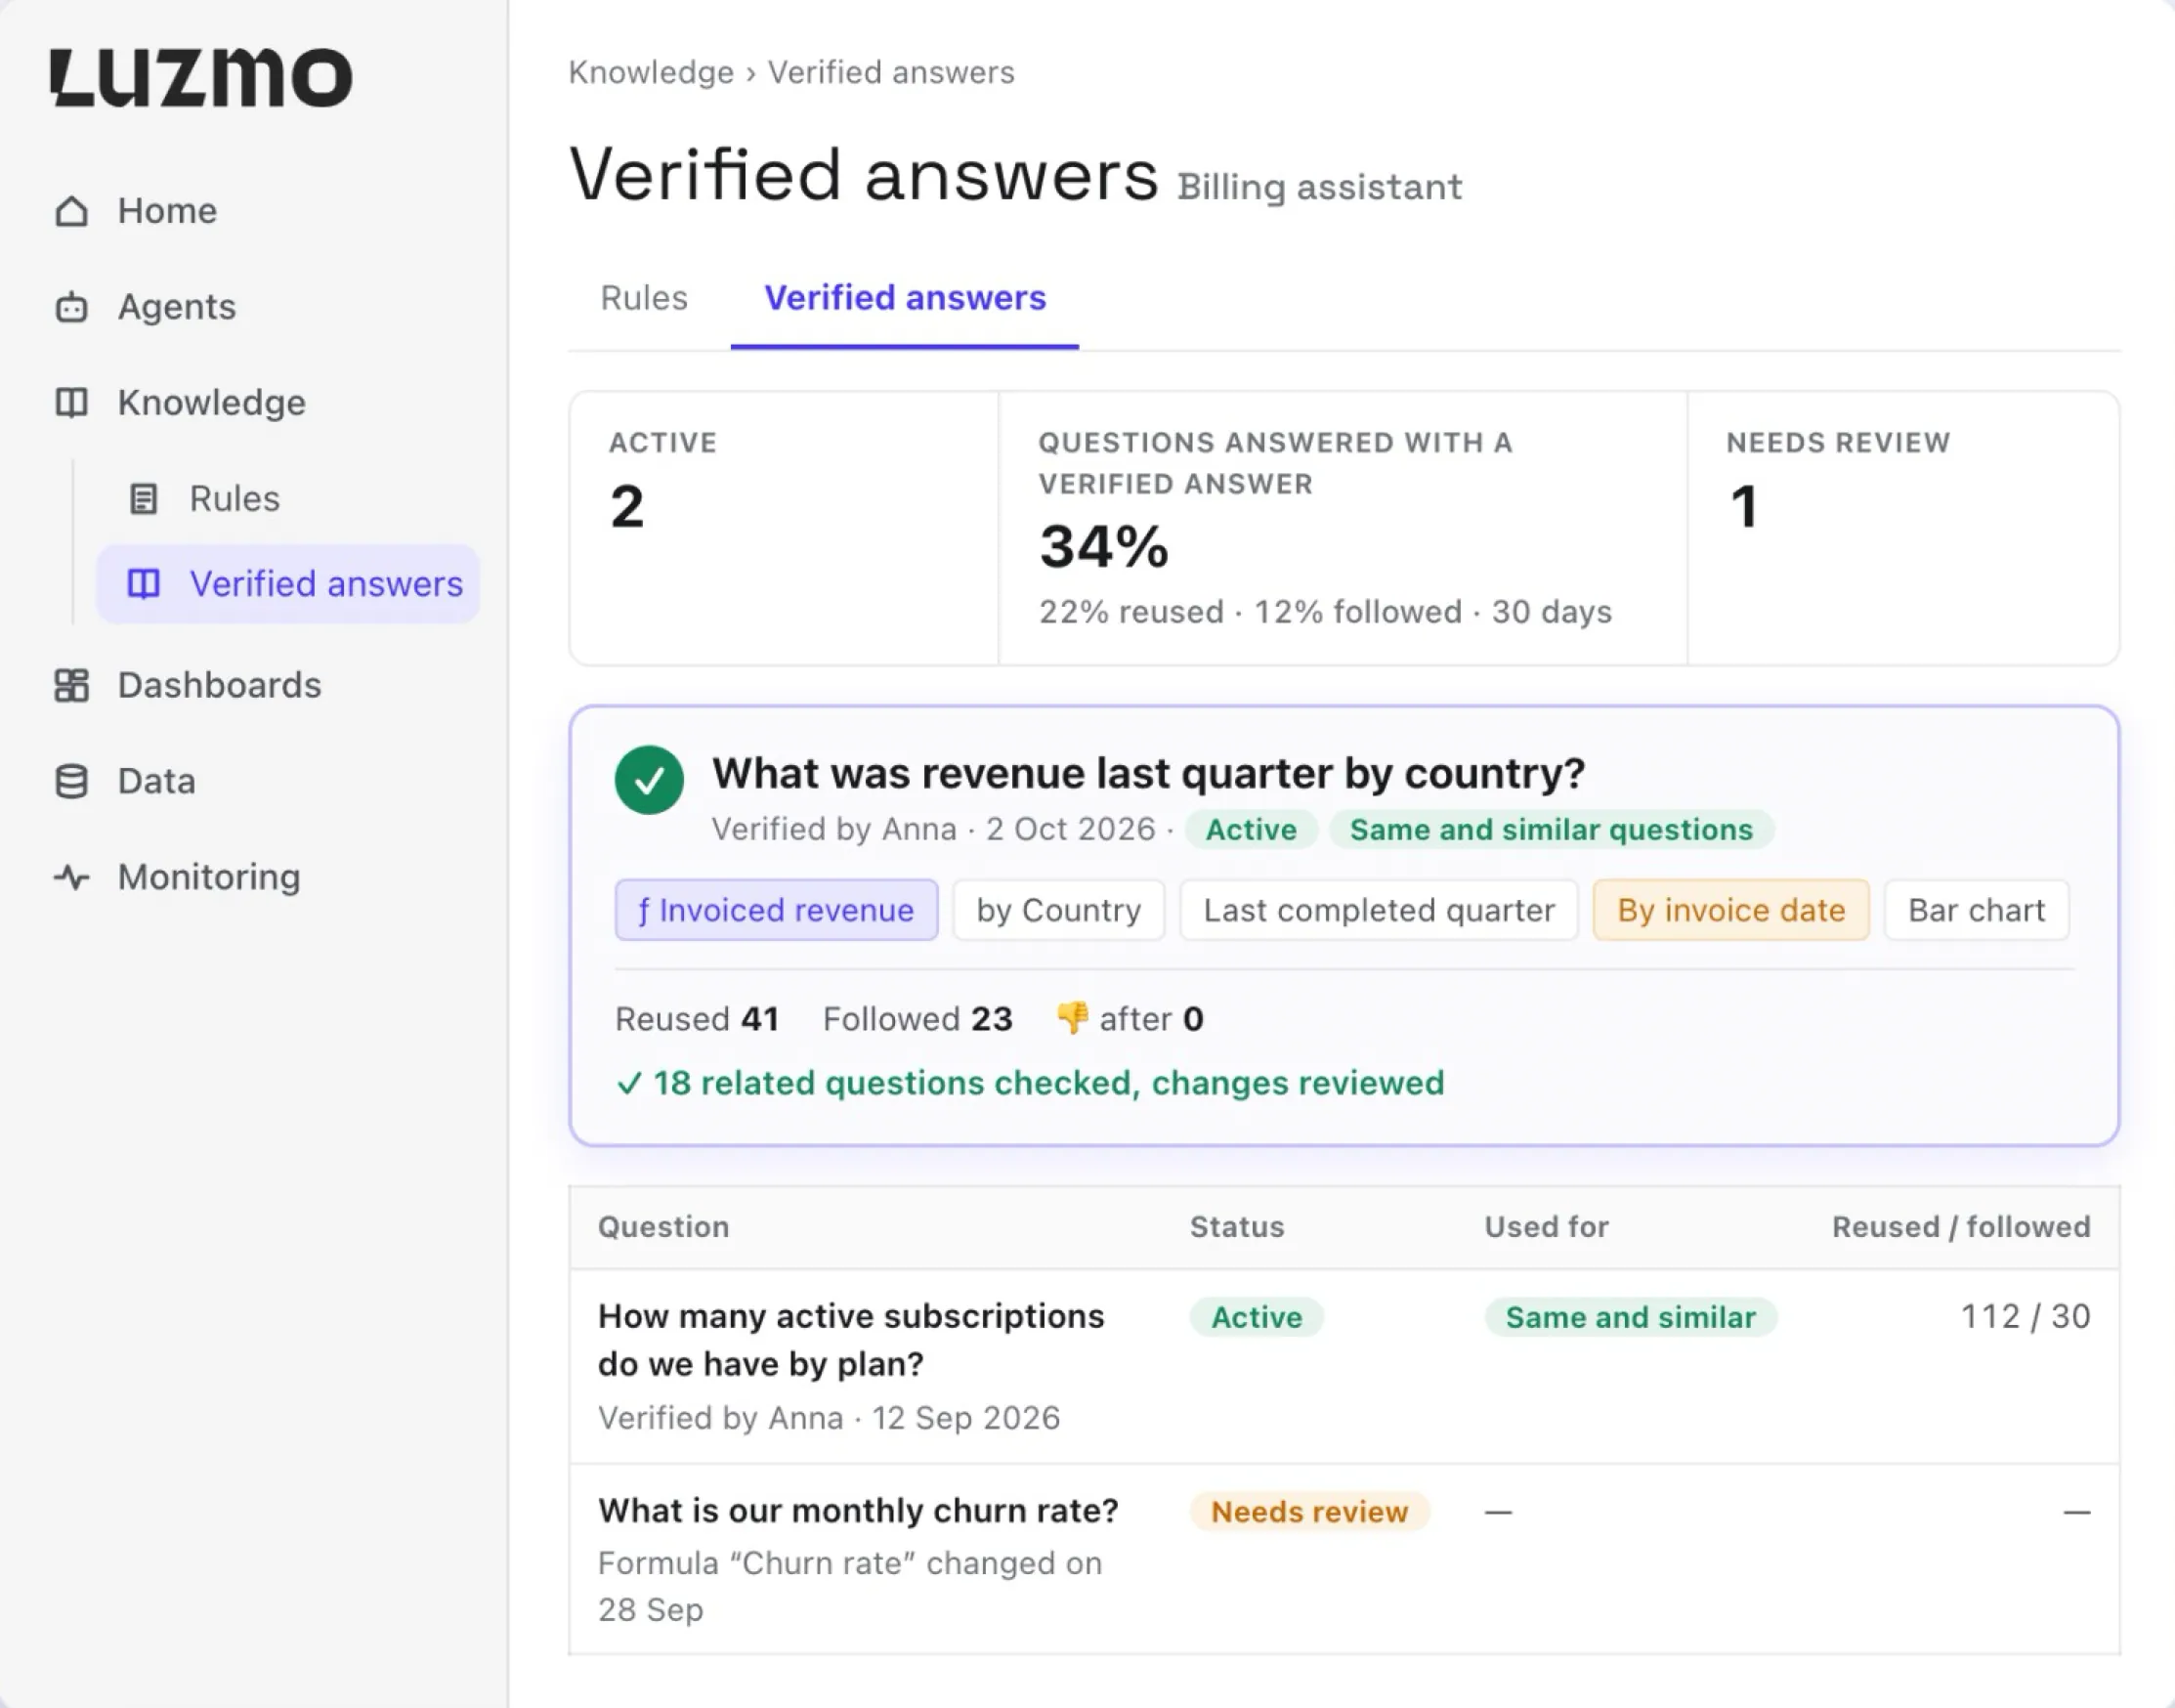
Approve the answer to a key question once. Agents reuse it.
Agents run the approved method on each customer's own data, for the same and similar questions. Verify from the chat in two clicks, Luzmo flags what changed, and every reply shows which verified answer it used.
Proactive insights
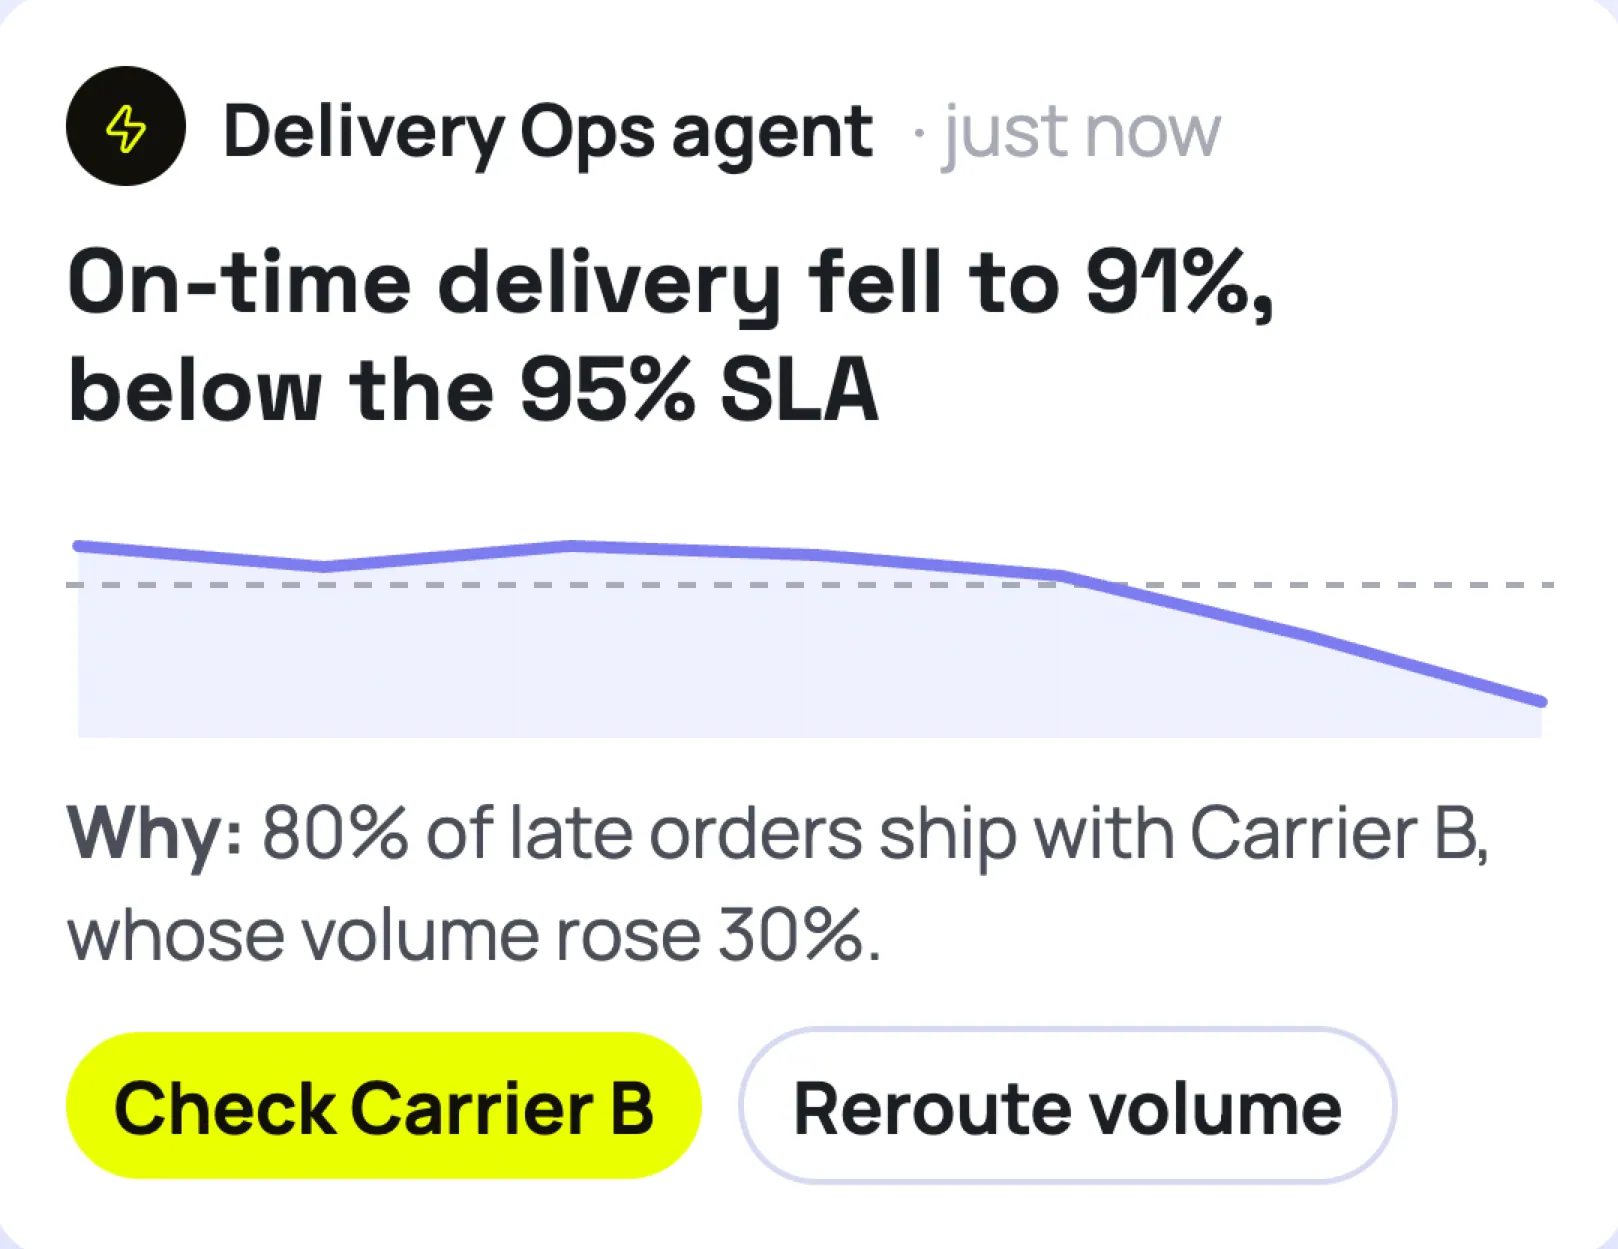
From what changed to what to do next.
Agents flag what changed, explain why, and suggest a next step. You pick the metrics to watch and when to alert, and define the actions agents can recommend to your users.
Simplified embedded dashboard creation
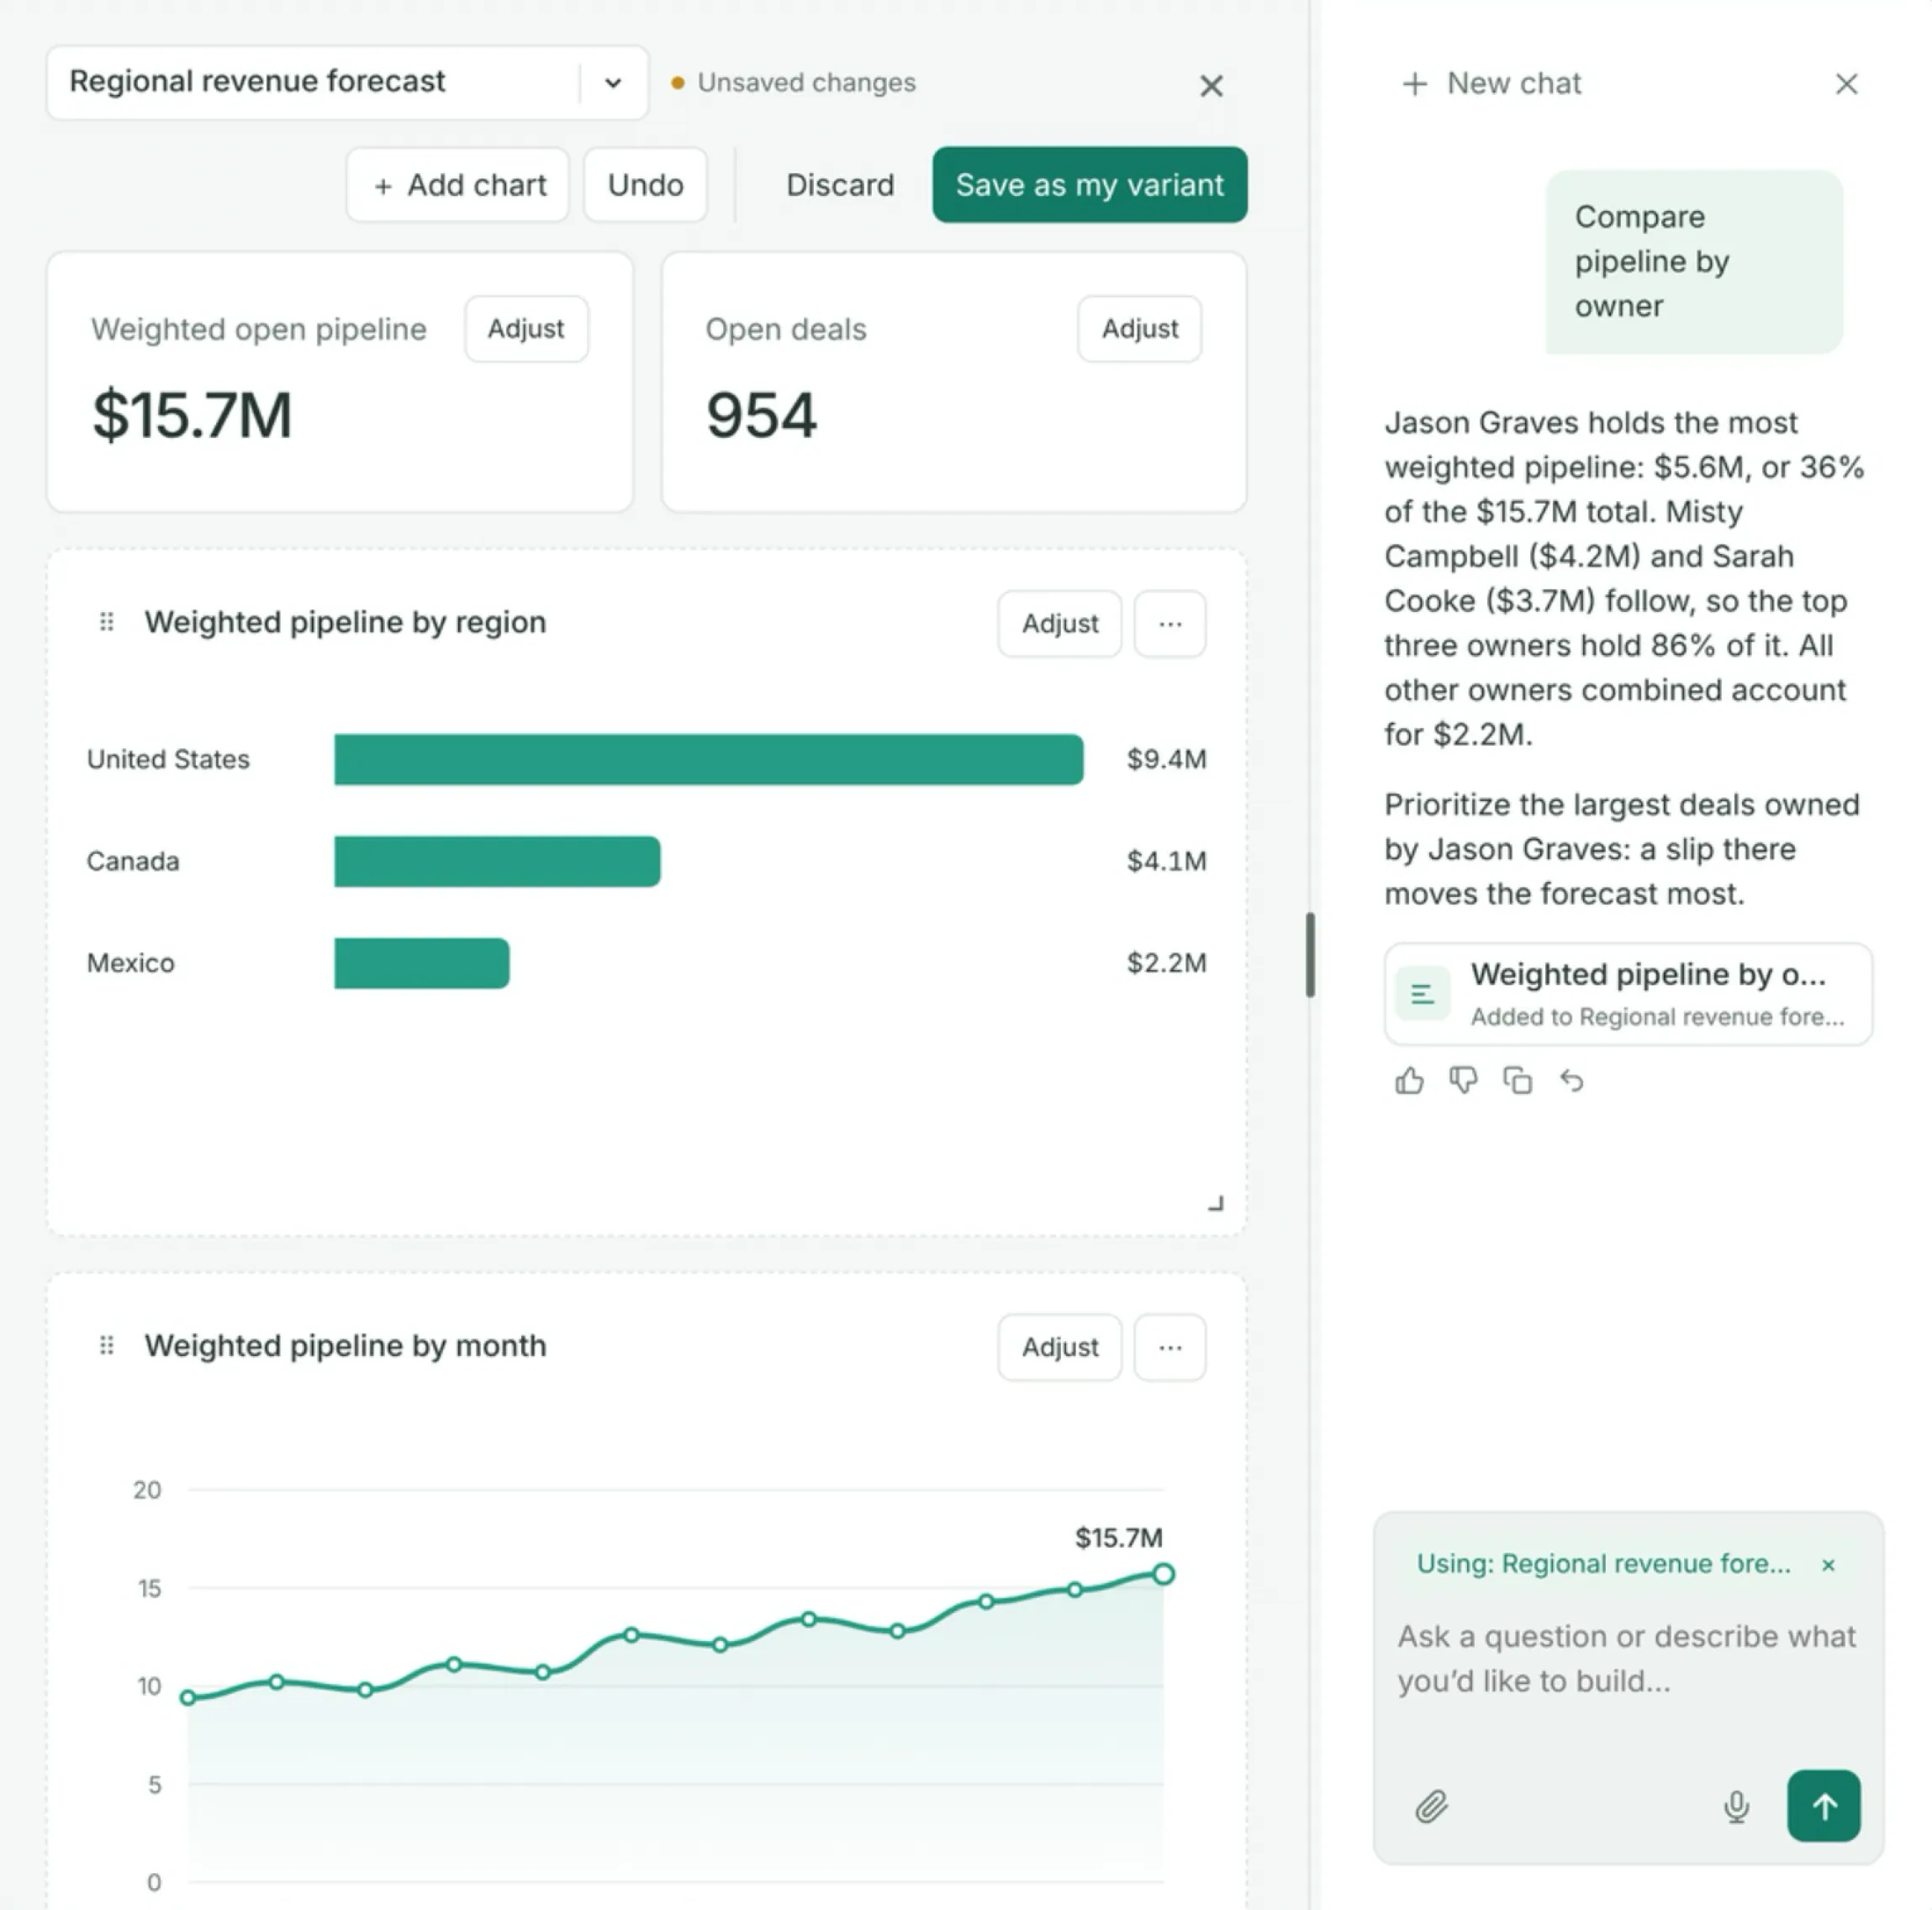
Templates your users make their own, by clicking or by asking.
Users start from a template, tweak it, and save their own version. Every action works in the UI and through the agent, users can ask open questions and add the answers, and it all ships as one ready-made component.
KPI widget with period comparison
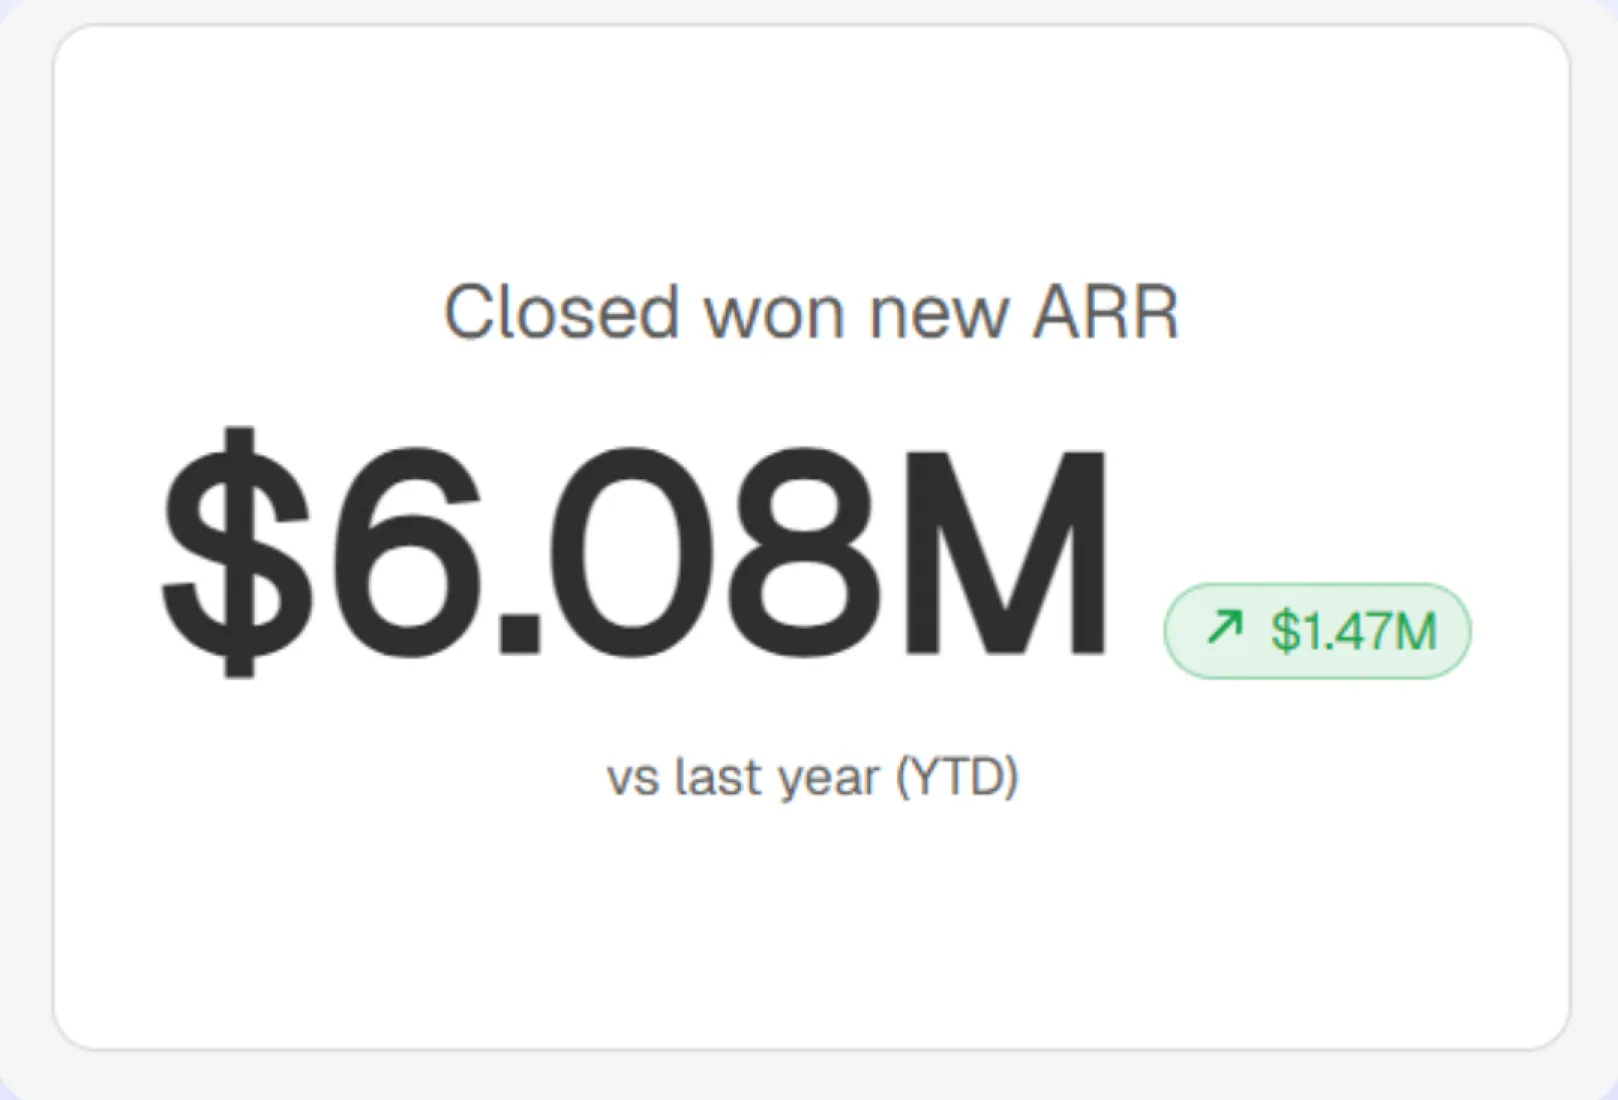
A KPI and its change, in one widget.
Show the change versus a previous period as an absolute or percentage change, with automatic period-to-date for incomplete periods. It follows your date filters, and a label names the compared period, like "vs previous month (MTD)".
Actively building this quarter, not a dated commitment. Scope and timing can shift.
Good decisions start with actionable insights.
Build your first embedded data product now. Talk to our product experts for a guided demo or get your hands dirty with a free 10-day trial.

Book your session with our analytics expert.