Angular Dashboard Libraries: Which One To Use in 2025?
Developing an analytics dashboard for your web app is no joke. At least not if you need to start from scratch. Luckily, Angular developers can rely on tons of UI kits to build out their web app, including analytics.
But which libraries exist? And which ones are best for your use case? Below, you’ll find a comprehensive guide to help you get analytics up and running in Angular in days, not months.
What is Angular?
Angular is a front-end web development framework, developed by Google and maintained by its community. It’s an open-source Typescript library, most popular for single-page applications (SPAs) and dynamic front-end web applications. Node.js is often the go-to choice for the back-end of web apps built in Angular.
Developers like Angular for its modular architecture. It’s made up of small Angular components, each responsible for a different part of the user interface. This structure makes it much easier for developers to test and maintain their code base.
AngularJS - the JavaScript version of this library - lets developers use and extend HTML syntax to build web app components. However, in January 2022, AngularJS reached End-of-Life, so it’s no longer maintained.
React vs Vue vs Angular
Of course, Angular isn’t the only front-end framework out there. React and Vue.js are popular alternatives, and so is React Native for mobile apps. Although the focus of this article is Angular, here are a few key differences to consider if you’re still figuring out your perfect stack.
- Angular is great if you’re looking for robust architecture and comprehensive tools, but still want to build and ship things quickly. A popular choice for enterprise apps with more rigid guidelines.
- React is the best option if you want flexibility. With its component structure and wide range of libraries to pick from, you can build UIs quickly and efficiently. Popular with startups and larger companies alike.
- Vue is awesome if you want to scale incrementally. It’s flexible, quick to learn, and easy to adapt as you go. You can use as many or as few features as you want, which makes it great for a wide range of projects.
Why use Angular for analytics dashboards?
Angular is a versatile framework you can use for any type of web-based app or feature, analytics included.
If you need to start from scratch, building dashboards for your customers can quickly take months of development time. Especially if your users need more advanced analytics functionalities, like data exploration and drill-through, predictive analytics, or triggering email alerts.
To speed up deployment, more and more developers flock to Angular libraries to build their end-user analytics. Let’s look at some of the top Angular charting libraries.
Best Angular chart libraries
Luzmo
For the most comprehensive analytics component, look no further than Luzmo’s embedded analytics platform. They have data visualization libraries available for all major front-end frameworks, including Angular.
With their Angular npm package, any developer can embed stunning data visualizations in their Angular applications with just a few lines of code. It comes with +40 visualization types, and a load of customizable styling options beyond just fonts and colors. Dashboards are responsive by design, and even adaptable per device.
Developers can use secure authentication options that easily hook into any existing auth systems - including Auth0. With the extensive API, they can even set up advanced interactions with other parts of their Angular app. All with minimal code and limited effort.
At the same time, colleagues in business roles, like customer success or account management can build and edit reports with a simple drag-and-drop editor. This means you don’t need to waste scarce engineering resources on maintaining analytics. Without touching a single line of code, anyone can update dashboards even after they’ve gone into production.
This combination of ease of use and robust power makes Luzmo stand out from other chart libraries. You’ll need a commercial license to use Luzmo, but you can try out all their features on a free trial. Pricing is also available publicly on their website.
ngx-charts
Built on top of D3.js, ngx-charts is an open-source Angular library, offering many reusable chart components. Besides the common bar charts, line charts and pie charts, it offers more complex visualizations like heat maps and bubble charts.
If you only need a few specific charts for your app, ngx-charts is a great option. It’s easy to manage, with many customization options and responsiveness. Especially if your need for more or different charts is unlikely to change long-term, developers will like its declarative approach to charting. Bind your data to a chart component, and the library will handle rendering and updates for you.
Plotly.js for Angular
If you want really complex visualizations across multiple platforms, angular-plotly.js makes a good choice. It’s essentially a wrapper around Plotly - a popular open-source JavaScript chart library - which makes it suitable for Angular apps.
Plotly easily handles large datasets, and has powerful rendering. Also on the visualization side, it offers more advanced chart types than most simpler libraries, including statistical and scientific visualizations. This makes it a perfect library for researchers and scientists, but if you’re looking for something easier to get up and running quickly, Plotly may not be for you.
Fusioncharts
Fusioncharts is a JavaScript chart library which integrates in many front-end frameworks, like React, jQuery, and also Angular. With angular-fusioncharts, its UI component for Angular, developers can choose from 100 different widgets, and interactivity features like tooltips, drill-down and more.
Like Luzmo, Fusioncharts is also a commercial software, so you’ll need to get a license to use it. If you’re looking for something powerful with many customization options and don’t mind getting your hands dirty with programming, Fusioncharts is a great option. If you’re looking for something that’s easier to use, and low in maintenance, Luzmo might be a better choice.
How to build an Angular dashboard with Luzmo
In this short tutorial, you’ll learn how to add a customer dashboard to your Angular app using Luzmo. If you’re using a different library, you might need a few extra steps.
1. Install npm package
First, you’ll install the Angular npm package to start using the data visualization library. If you don’t have a Luzmo account yet, you’ll also need to create one (free trials are available).
2. Connect data
If you’re using a database or data warehouse like Snowflake or BigQuery, you can connect new datasets in just a few clicks. If we don’t support your favorite data source yet, you can easily plug them into your dashboard with Luzmo’s plugin API.
3. Create the dashboard
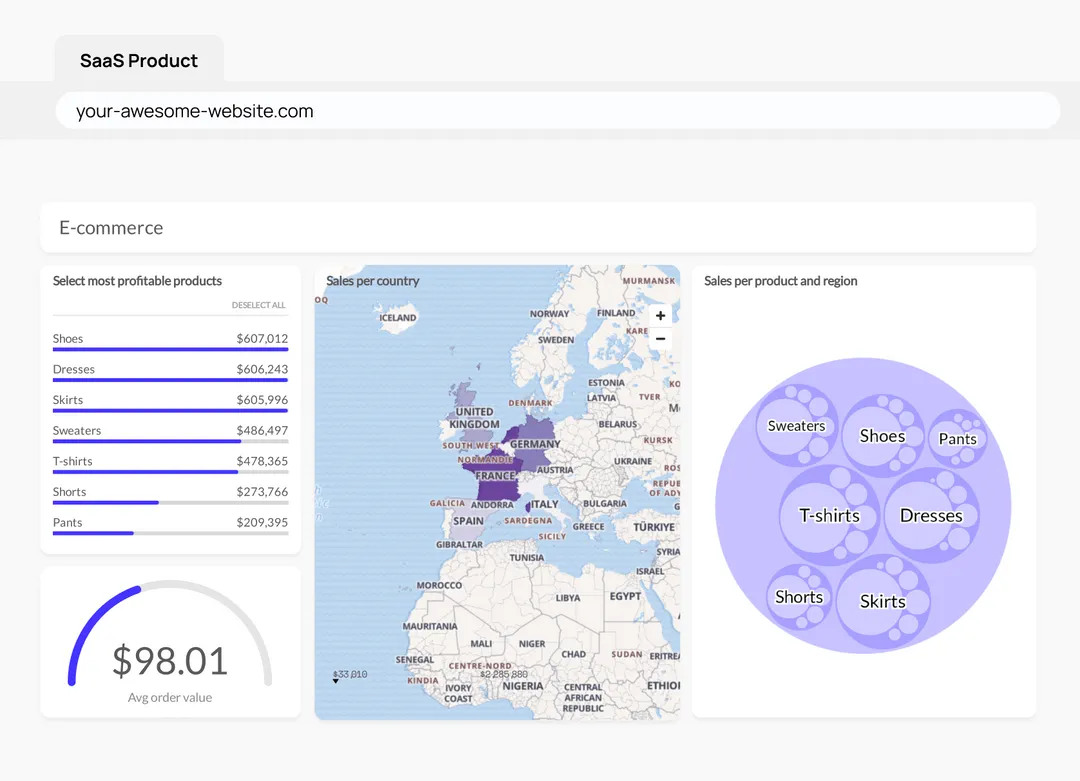
You can now create interactive charts and dashboards on top of your new datasets. All you need to do is drag and drop data and charts onto a canvas. Developers love it, because they don’t have to spend time on maintenance and updates. Instead, their colleagues in customer success or account management can easily make changes and publish updates to your app, without having to touch a single line of code.
4. Embed dashboards in your Angular app
When your dashboard is ready, you’ll use the Angular library to embed dashboards into your application. You can customize the fonts, colors, background, spinners, or even the timezone you want to use in your dashboard.
If you want to the extra mile and personalize dashboards for your customers you can set access rules with Luzmo’s Angular library. Depending on which user is logged in, they will see different data or dashboards.
If you want to make the dashboards interact with other parts of your applications, you can easily do so by adding just a few lines of code to the library. You can find more instructions to set this up on npm and in Luzmo’s developer documentation.
5. Publish
You’re all set to launch analytics dashboards in your SaaS app during your next deployment!
Angular analytics dashboard vs admin dashboard
Besides data visualization libraries, there are loads of templates for building an admin panel in Angular. Although these admin panels are also called a ‘dashboard’, it’s worth noting these templates aren’t suited for advanced analytics and charting. However, you may still run into some (limited) chart functions in some of these templates.
Written by

Ship the future of your data
Let us show you what Luzmo can do for your product.

Leave your e-mail and one of our analytics experts will reach out to you