 ChatGPT
 Perplexity
.png)
.png)
.png)
Build your first embedded data product now. Talk to our product experts for a guided demo or get your hands dirty with a free 10-day trial.

When you pick business intelligence software, you’re choosing the brain of your operations. Two of the most recognisable names are Tableau and Domo, and their offerings have evolved significantly since our last review back in July 2024.
This November 2025 update highlights the basics, visualizations, ease of use, connectors, performance and pricing, then introduces Luzmo’s Studio, Flex, IQ and Agentic APIs as an alternative.
Discussions often frame the debate as Tableau vs Domo or Domo vs Tableau.
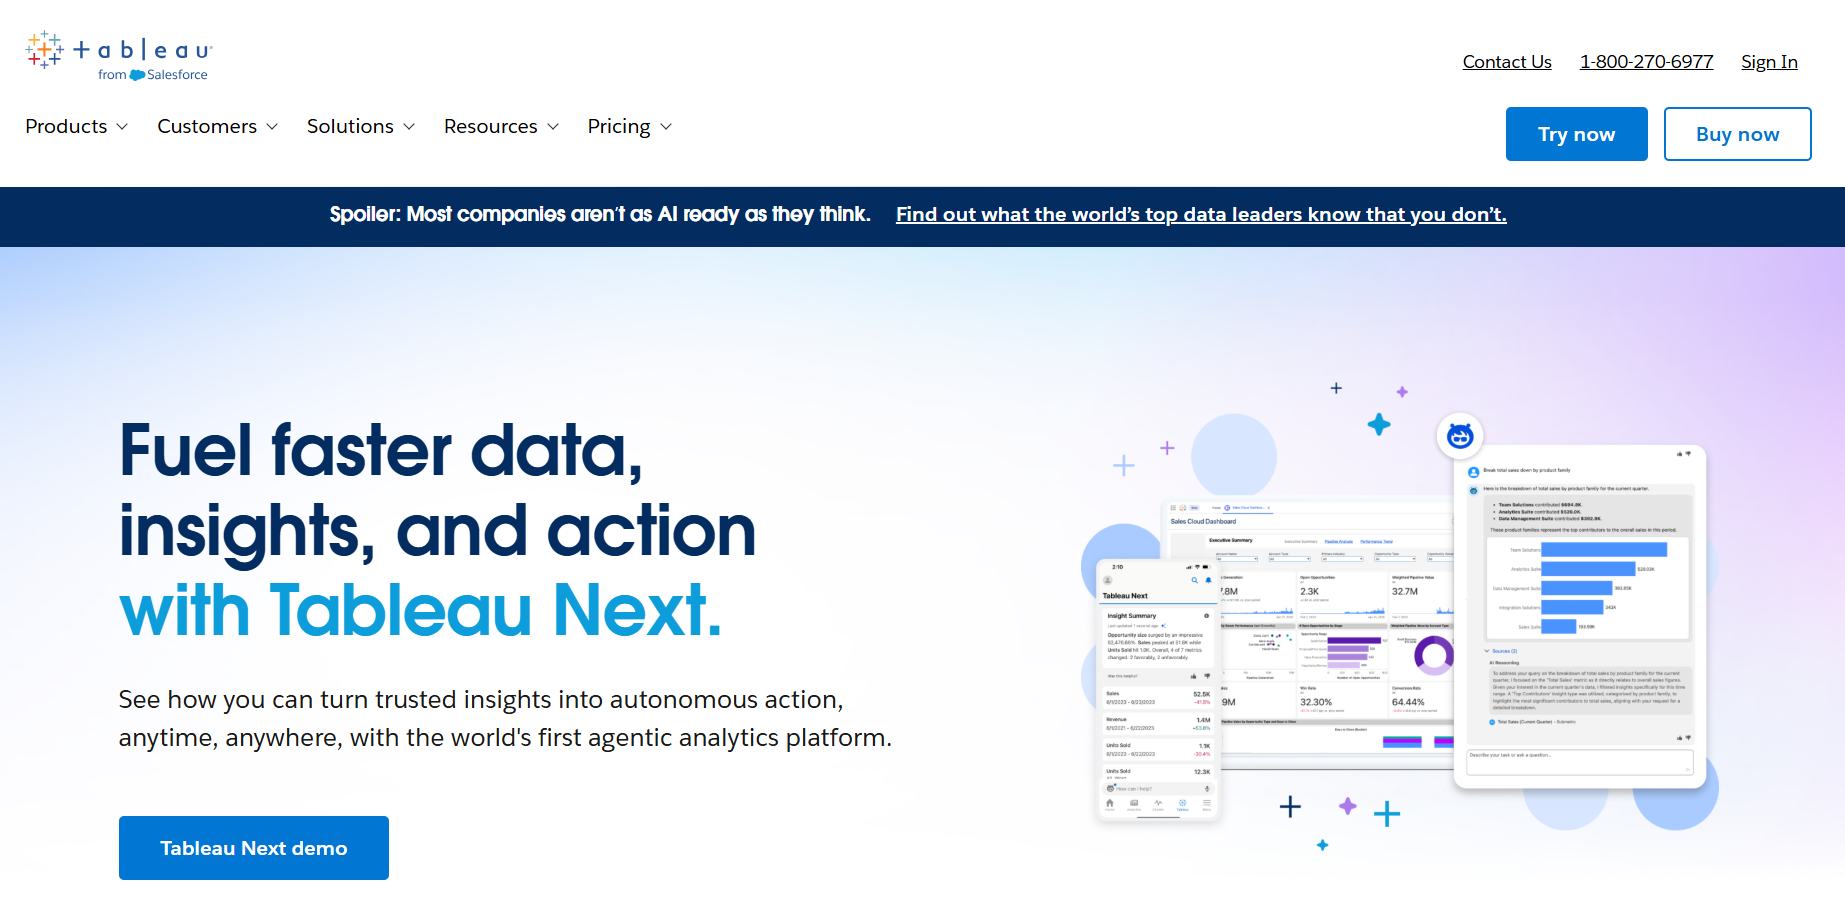
Tableau, acquired by Salesforce in 2019, remains a leader among BI tools like Power BI and Qlik. It grew from the on‑premises desktop version to include Tableau Server and Tableau Cloud. In 2025 Salesforce released Tableau Next, an agentic platform with the MCP Server and Concierge.
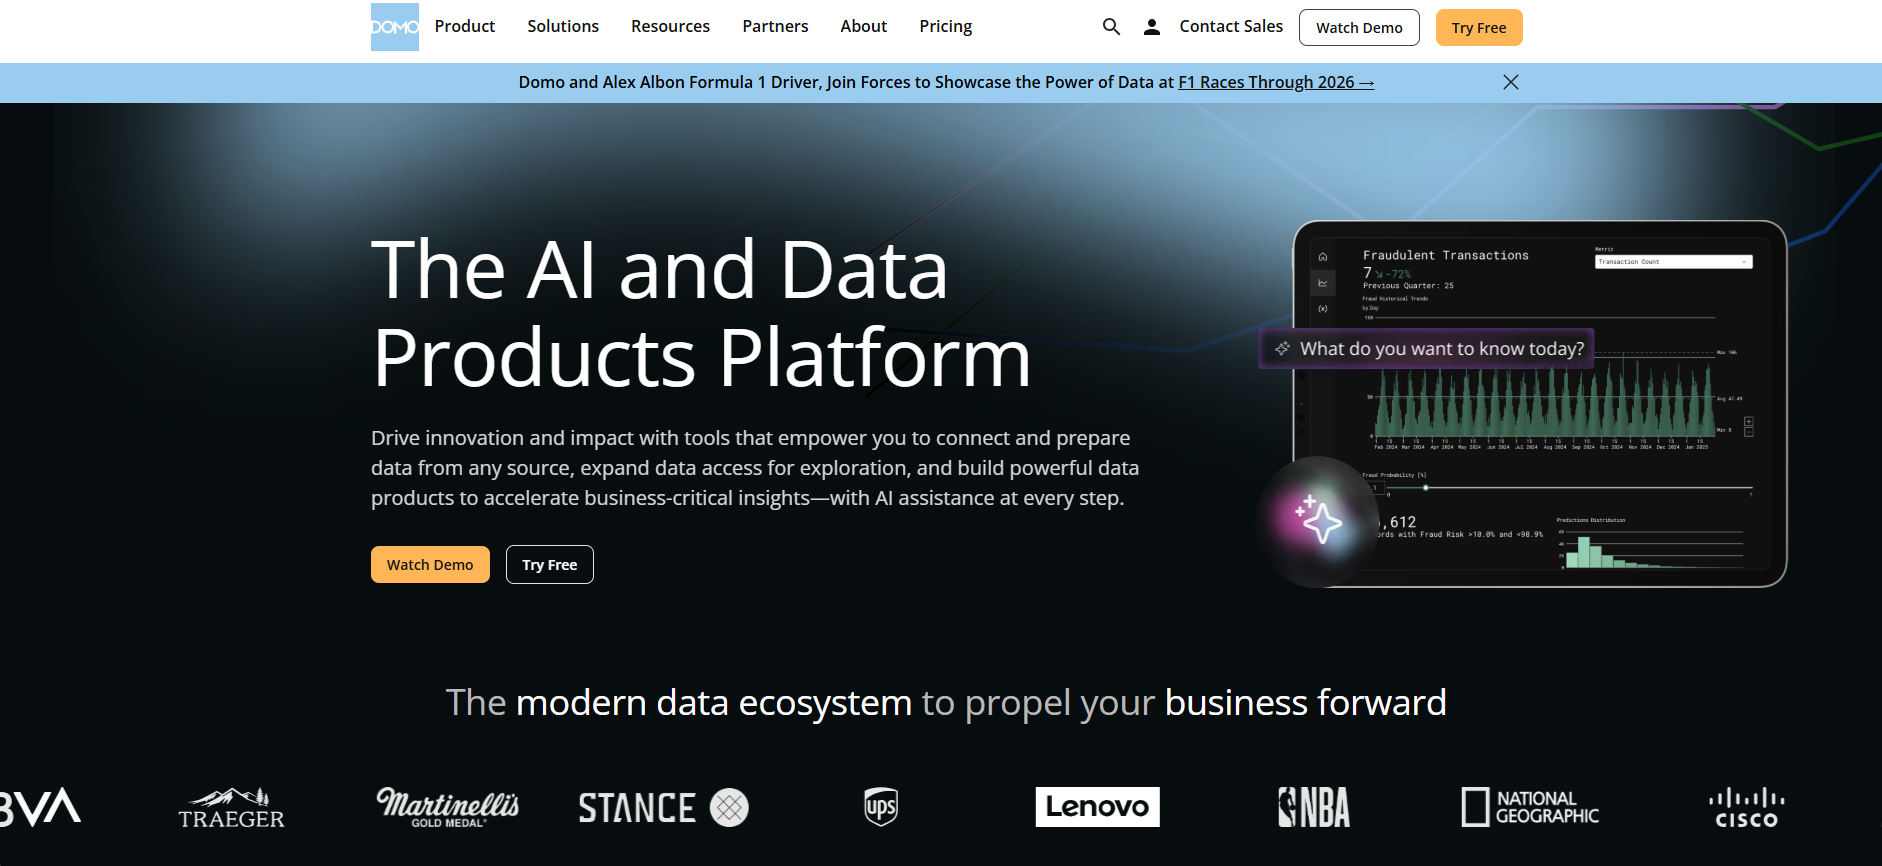
Domo, launched in 2010, positions itself as a cloud‑first analytics platform. At Domopalooza 2025 it announced Domo Agent Catalyst and app‑building components. With more than 1,000 connectors and consumption pricing, Domo pitches itself as a tool that wins, indeed some analysts say Domo wins for teams needing real-time dashboards.
Discussions often pit Tableau vs Domo, or compare features vs Tableau. Tableau markets itself as a BI solution and analytics platform with on‑prem products like Tableau Desktop and Tableau Reader alongside cloud offerings. Its interface appeals to analysts and business users, providing interactive visualizations, data analytics and a variety of data sources. Some argue Domo is better than Tableau for specific use cases.
Domo's credit model allows unlimited users but charges for queries; domo also offers multi‑account connections, AI helpers and pre-built templates. Your team might choose to like Domo or like Tableau more depending on whether you need drag‑and‑drop or end-to-end BI, a programming language like r and Python, or features like Magic ETL and App Studio - Domo includes such capabilities, while Tableau offers many chart types and ways to show off visualizations. Choose according to your business needs, data science priorities and data analytics goals.
Tableau is a leading visualization tool, offering drag‑and‑drop graphs, maps and charts. The 2025 update added ad‑hoc calculations, responsive widgets and an external embedding SDK. Free products like Tableau Public and Tableau Prep help users build a native chart for almost any metric, and Tableau’s semantic layer lets agents return context‑rich answers.

Domo’s App Studio provides a drag‑and‑drop builder with Table Elements that combine cards, lists and banners. Domo allows users to duplicate datasets and connect multiple accounts, but deeper customization requires learning its proprietary functions. It offers fewer chart types than Tableau, yet still features pre-built components and supports embedded analytics.

Tableau aims to balance power and accessibility: features like Show Me 2.0, dynamic colour ranges and Concierge make it user-friendly, but advanced work still requires SQL, ETL and sometimes dedicated data analysts. Its mature community means working with Tableau or finding developers is relatively easy. Beginners can use Tableau via drag‑and‑drop self-service dashboards, while experts script calculations, perform data modeling, use geocoding or connect to a data warehouse.
Domo promotes self-service BI and no-code ETL with Magic ETL’s visual transformations and AI suggestions. You can drag and drop widgets and query data without SQL, yet using Domo on large or complex data remains slow and its smaller community makes expertise scarce. Advanced workflows require learning Domo’s workflow and credit model. For quick dashboards Domo is easier; Tableau scales better for enterprise.
Both tools connect to a variety of data sources.
Tableau integrates with major data warehouse services, spreadsheets and SaaS apps, and can import published sources into its semantic layer. It handles scheduling and caching through dataflow and data pipelines.
Domo’s Appstore has over 1,000 connectors and emphasises it's possible to connect to data quickly without code. Magic ETL includes window functions and AI SQL helpers. However, because Domo’s pricing ties to credits and dataset size, large volumes of Domo data can be expensive.
Tableau’s connectors span more systems, but Domo’s marketplace can feel more seamless for non‑technical users.
Tableau’s in-memory engine performs well with star schemas and aggregated extracts. The Performance Insights dashboard helps identify slow visualizations.
Domo is cloud-based and can ingest streaming data, which some teams argue makes it better than Tableau for near‑real‑time metrics. But heavy dashboards still lag.
Your dataset size and deployment model (cloud or on‑premises) will determine which tool handles complex data better. Domo’s Magic ETL improvements (undo/redo, action history) help data engineers, yet overall speed still hinges on dataset volume and credit allocation.
Domo uses a custom pricing structure: a 30‑day free trial, then consumption‑based charges for queries, connectors and dataset size. This allows unlimited users until credits are consumed but can lead to unpredictable costs.

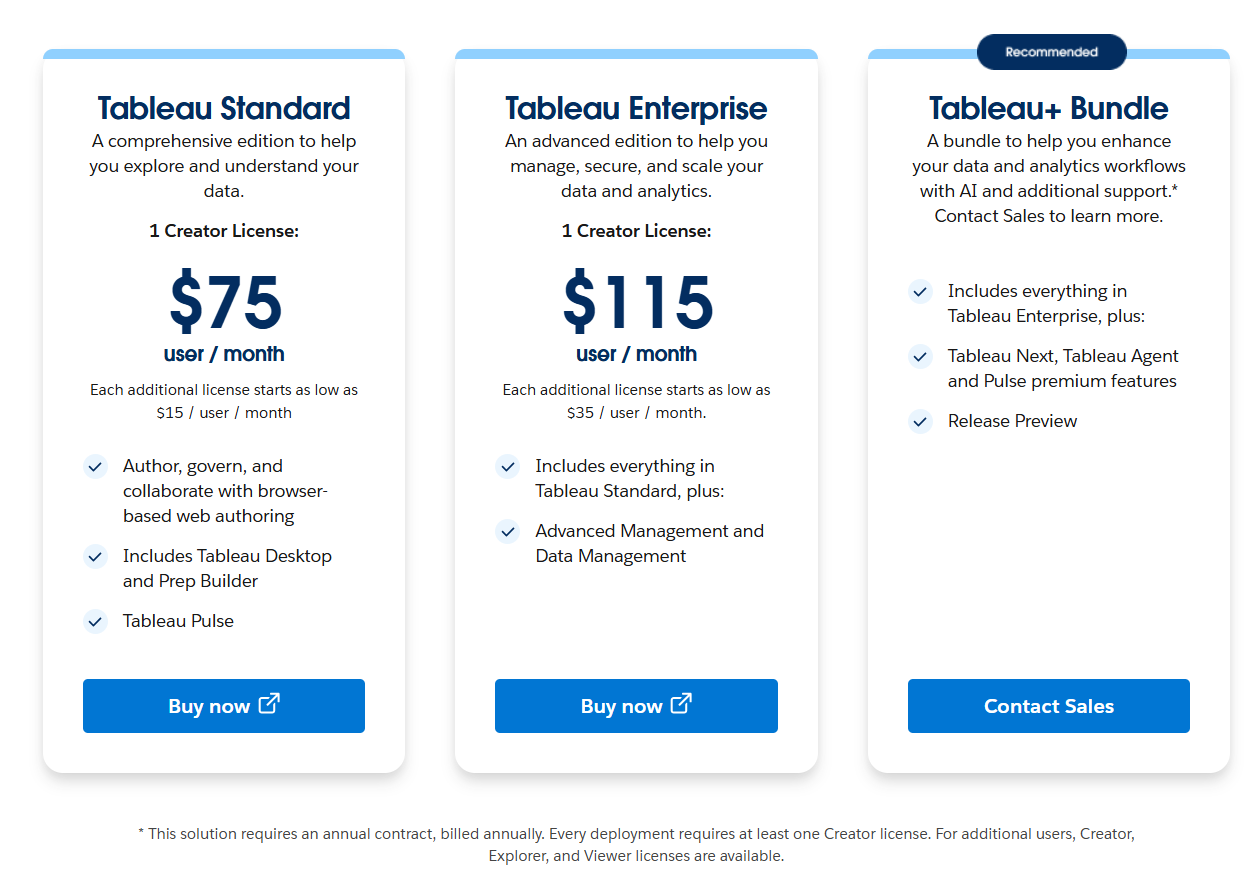
Tableau uses per‑user licences: around $75 per Creator and $15 per Viewer for the Standard plan, and about $115 per Creator for the Enterprise tier. Advanced embedded analytics require the Tableau+ bundle.
In general, Tableau is more predictable for small teams, while Domo may be cost‑effective at scale if you manage credits carefully.
No single tool wins in the Domo and Tableau debate.
Use Tableau for polished visualizations, a large community and predictable per‑user licensing: it excels at analysis and visualization and it makes advanced analytics easier.
Choose Domo if you prefer a simple builder, diverse connectors and a flexible credit model, but be mindful of costs.
Align the choice with your business needs and skills: Domo’s intuitive builder allows small teams to explore ideas quickly, while Tableau’s ecosystem suits enterprise projects. Consider whether you need customization or native chart types and whether pricing clarity or flexibility matters more.
For embedded analytics without complex licensing, consider Luzmo. Built for SaaS and product teams, it offers transparent pricing and connects to nearly any data source.

Luzmo Studio is a drag-and-drop dashboard builder with more than 40 chart types and real‑time updates. You embed Studio directly into your app so end‑users explore data as they would in Tableau dashboards, but without extra servers. Studio supports multi‑language and multi‑currency dashboards, white‑labelling, CSS injection, row‑level security and caching.
Luzmo Flex SDK gives developers code‑first control to programmatically build dashboards. It scales from low‑code to full code, automating data pipelines and security behind the scenes.
Luzmo IQ enables conversational analytics through a chat widget and produces charts or an executive summary. It uses vector embeddings for fast search and an access‑control layer for privacy, and integrates with Slack and a Workflows API for instant action.
Luzmo Agentic APIs provide modular AI endpoints that describe datasets, perform semantic search and generate formulas or charts. Agents can be chained for multi‑step workflows or used to build chatbots via /iqmessage.
Plans start at €495/month for Starter, €1,995/month for Premium, with Enterprise options available—so you get predictable costs and can scale your embedded analytics as your product grows.
Tableau and Domo have both evolved with AI and semantics, but they cater to different audiences. Tableau excels at mature governance and deep analytics, Domo offers speedy deployment and a low-code builder. Luzmo provides a compelling alternative by combining pre-built dashboards, developer control, conversational analytics and modular AI. Your decision should balance features, budget and how easily your team can adopt the platform. Whether you choose Tableau, Domo, Luzmo or another tool, match the solution to your integration needs and make sure it empowers your team to turn data into decisions.
If Luzmo sounds appealing to you now, try it for free or book a demo today.

All your questions answered.
Build your first embedded data product now. Talk to our product experts for a guided demo or get your hands dirty with a free 10-day trial.


